This site is dedicated to showing practical examples of D3.js usage: from beginner, tutorial level, to more advanced usage.
Data and resources used on this site are publicly available, and you are free to reuse them at your own discretion.
Emphasis is on building solutions that work just with browser, relying only on HTML and JavaScript: no plugins, frameworks and minimal usage of 3rd party scripts.
There is a Github project related to this site on github.com/kmposlovni/D3Tools.
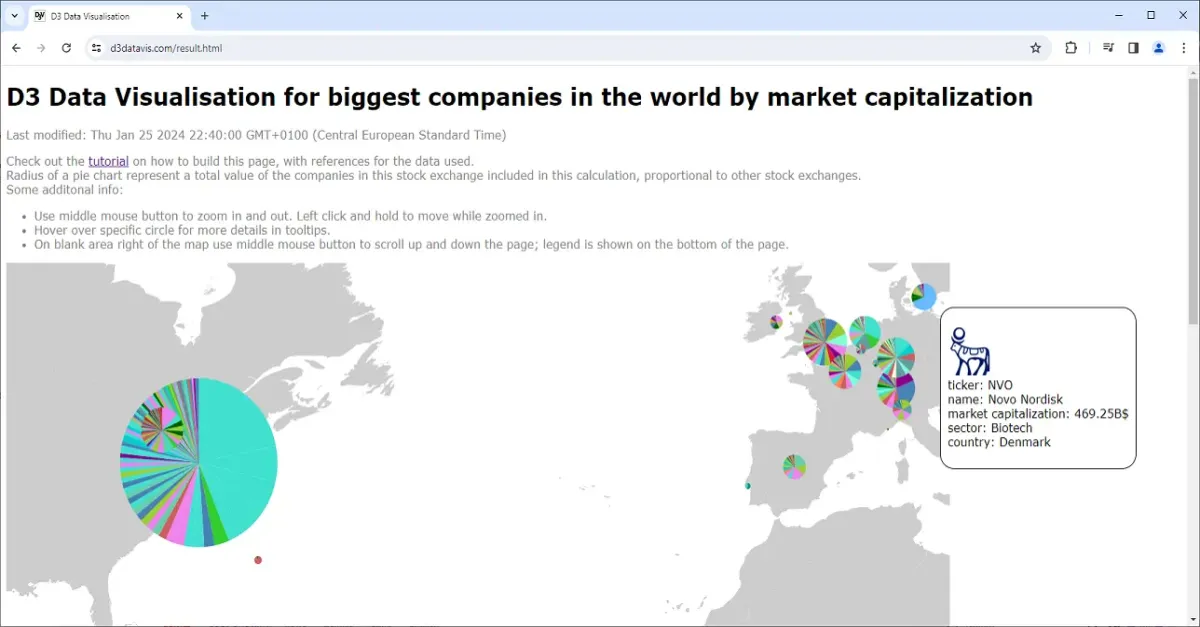
This is step-by-step tutorial for building pie chart visualisations on top of world map.
Detailed description in every step, with the resources, makes it reproducible in almost every environment.
Check out the tutorial on how to build visualisation of the biggest companies in the world by market capitalisation.

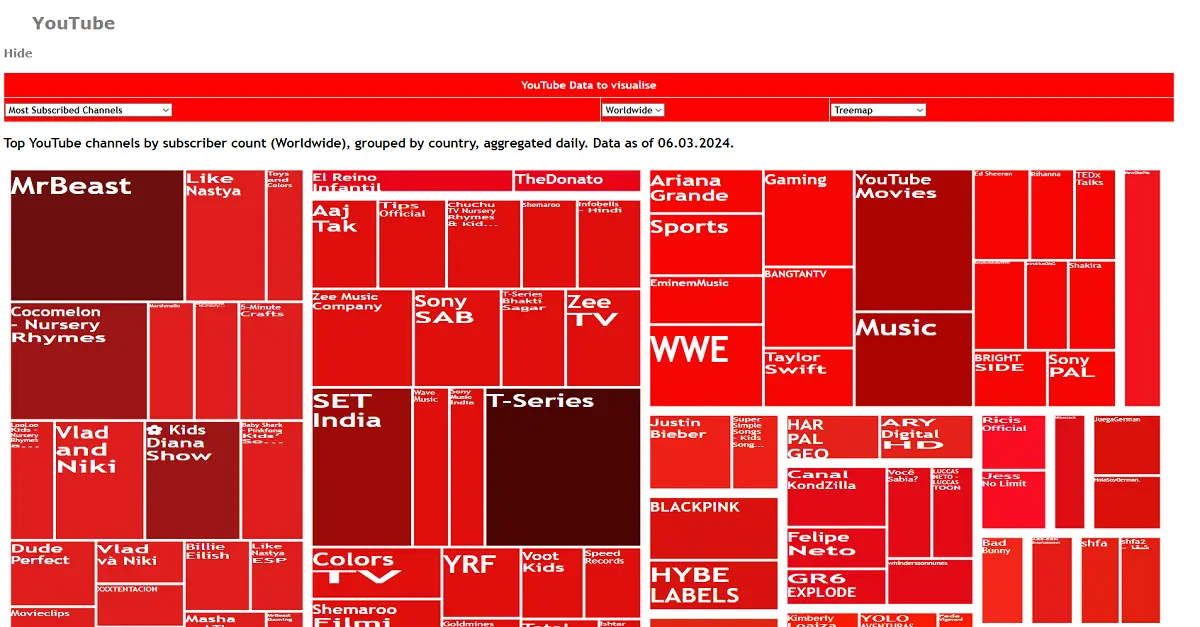
Not so much tutorial, but more a showcase, of some more advanced usage of D3.js.
Data is scraped off the internet, consolidated into format recognizable by the D3 engine, and displayed using procedural generation.
You can select multiple sites and multiple types of visualisations. Check out visualisation of the biggest social media sites.

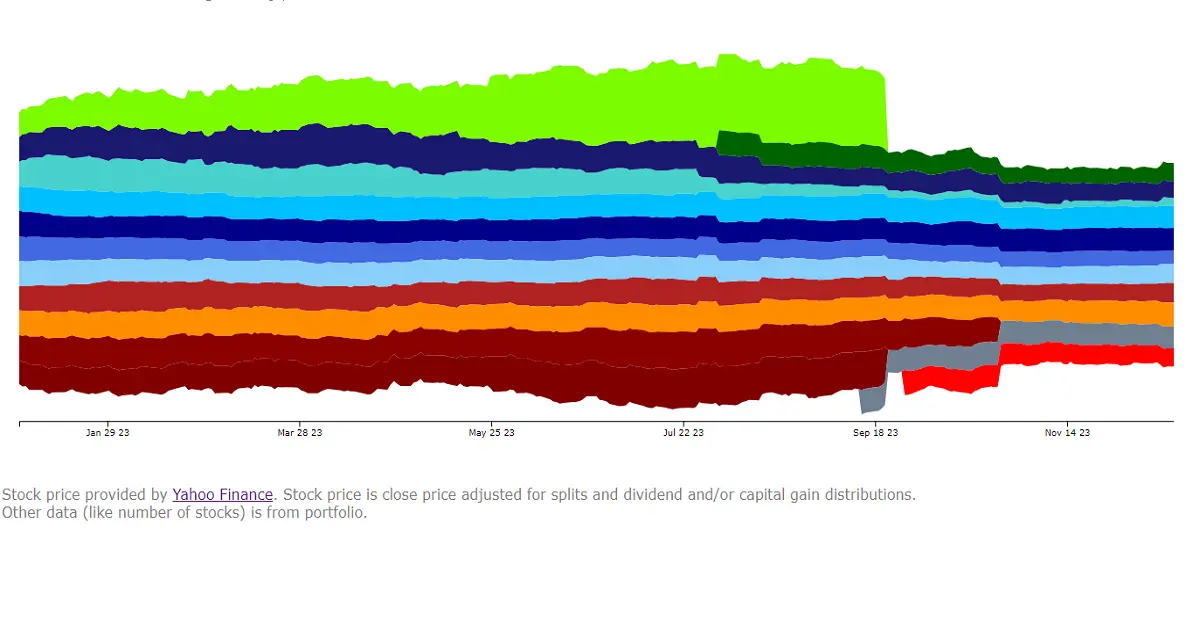
This is another showcase, but far more simple than visualisation of social media sites.
Data is from the portfolio combined with data from stock exchange.
This is an example of a streamgraph that can be found on this page.

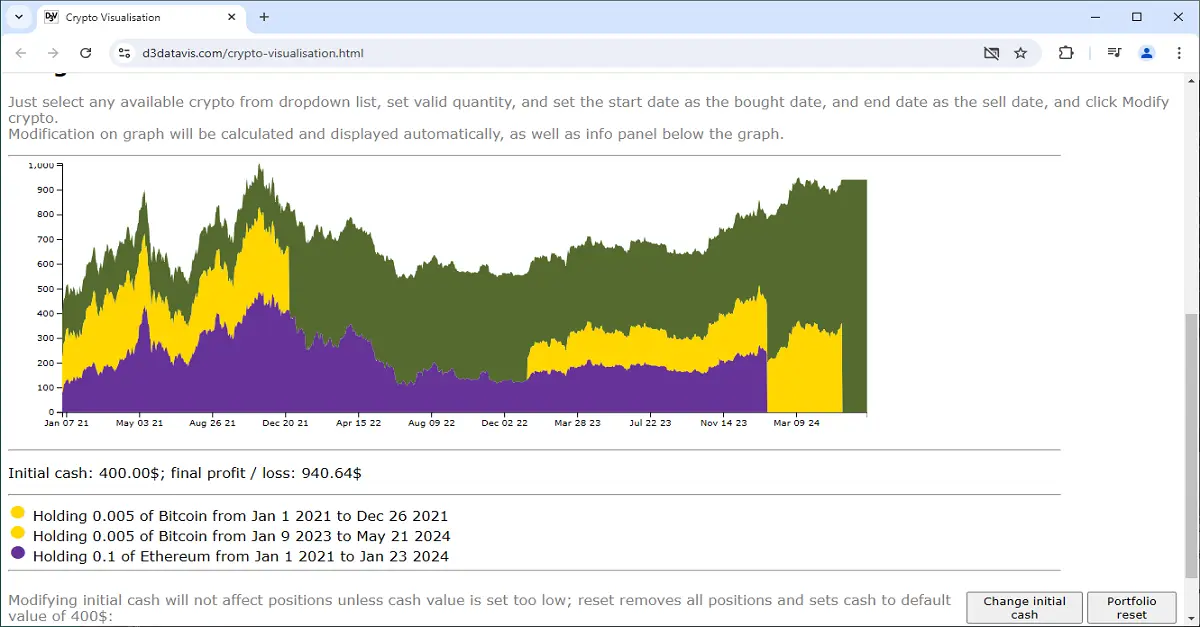
You can buy and sell crypto, adjust available cash, and observe the results of your trades on this interactive stacked area chart.
Interactive portfolio builder is on this page.
