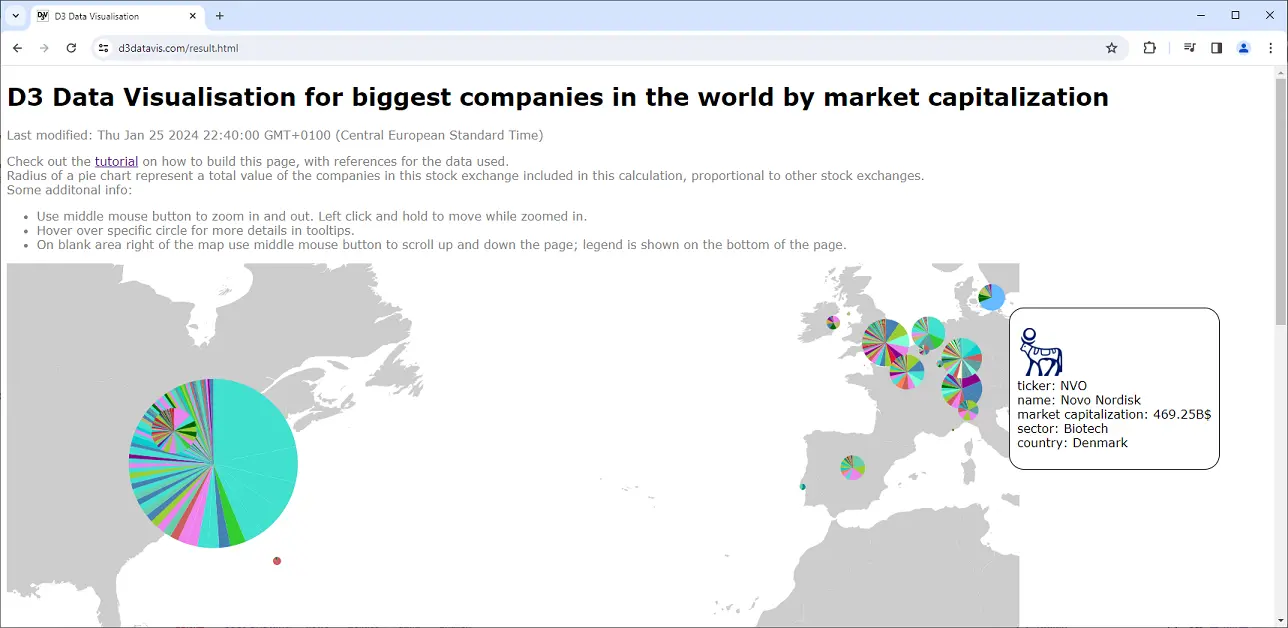
This is short and beginner-to-intermediate level tutorial that will show you how to build a data visualisation for biggest companies in the world by market capitalization.
We will use D3.js library to build a pie chart with zoom and pan functionality. We will also add a legend to the chart.
There are some strong arguments why pie charts should not be used in data visualisation, but pie charts will suffice for this demonstration.
The advantage of this approach is that you only need an up-to-date browser for development and simple web server for deplyoment.
No local installations, no 3rd party libraries or tools except for pako, which can be omitted if performance is not a consideration.
Web server must have capability to handle standard content types.

For more advanced usage of D3 Visualisation framework, check out the most popular social sites data visualisations.
Or check out the main page of this site for even more resources.
This is not a D3 or HTML / JavasScript beginner's tutorial, you will need to have a basic understanding of HTML, JavaScript and D3.js.
You can find good HTML beginners tutorials on w3schools.com.
Great JavaScript beginners tutorials can also be found here.
You will need to have a basic understanding of D3.js library. Check out D3.js website for more information and resources.
You will need to have a basic understanding of JSON. For explanation of JSON and its relation with JavaScript, you can visit MDN Web Docs.
You will need to have a basic understanding of how to use a web browser as development tool.
Before continuing, make sure you have GeoJSON of world map created (one of sites that can generate it is geojson-maps.ash.ms), and have a local copy of market data that can be found here.
With the prerequisites covered, here is a framework on how to build this visualisation.
Steps presented in this tutorial can be reused for any other kind of data to visualise in similar manner.
We will use companiesmarketcap.com website to get data for the chart.
Key data used is market capitalisation, but we will use other data that will aid in the visualisation, like country of origin, and main sector of the company. More details of the companies can be found on the site, but we won't be using it.
For map of the world, we will use GeoJSON generated at geojson-maps.ash.ms.
Create a folder. This folder will hold HTML, JavaScript, and all other resources that need to be accessible online.
Create a file named index.html in the folder. This file will hold HTML code for the page.
Alternatively, you can name your file other than index, if you intend to have a navigable site. In that case, ensure you have proper site navigation in place.
Create a basic HTML page with JavaScript function, holding 2 divs. We will use them for graph and legend, respectively.
Here is an example of how this can be done, and using the console feature of a browser for checking:
index.html
        <!DOCTYPE html>
        <html lang="en">
            <head>
                <meta charset="UTF-8">
                <meta name="viewport" content="width=device-width, initial-scale=1.0">
                <title>D3 Data Visualisation</title>
            </head>
            <body>
                <h1 style="font-family: Verdana,serif">D3 Data Visualisation for biggest companies in the world by market capitalization</h1>
                <div id="d3vis"></div>
                <div id="d3leg"></div>
                <script>
                    document.getElementById("d3vis").innerHTML = "Here goes graph";
                    document.getElementById("d3leg").innerHTML = "Here goes legend";
                    console.log("JavaScript OK");
                </script>
            </body>
        </html>

Enable D3.js by including https://cdn.jsdelivr.net/npm/d3@7 as a script in the HTML header.
Then, create 2 js files that will hold JavaScript code for pie chart and legend, call them d3Legend.js and drawMapAndPiechart.js. Include them as scripts in HTML.
Create entry point functions in those files, that will be called from HTML. Functions must have single parameter div ID, of a div on HTML which holds rendered visualisation.
Function names may be redrawLegend in d3Legend.js and redrawVisualisation in drawMapAndPiechart.js.
Modify script section on HTML page to include calls to redrawVisualisation("d3vis") and redrawLegend("d3leg"). Make sure to include window.addEventListener resize handler to ensure that divs are properly rendered on window change.
Inside those functions, create SVG element, and append it to the div. Set width and height of the SVG element to match the div.
Before creating svg, you should call selectAll("*").remove() on div to remove any possible visual artefacts that may occur when window is resizing.
You should add d3.zoom().scaleExtent and on("zoom", function(d){ ... }) callback to the SVG element to enable zoom and pan functionality.
Here is how all files should look after this step is completed:
d3Legend.js
        function redrawLegend(divId) {
            const height = 50;
            const width = window.width;
            d3.select(document.getElementById(divId)).selectAll("*").remove();
            const svg = d3.select(document.getElementById(divId)).append("svg").attr("width", width).attr("height", height).append("g");
        }
drawMapAndPiechart.js
        function redrawVisualisation(divId) {
            const height = 0.95 * window.innerHeight;
            const width = 1.9 * height;
            d3.select(document.getElementById(divId)).selectAll("*").remove();
            const svg = d3.select(document.getElementById(divId)).append("svg").attr("width", width).attr("height", height).call(d3.zoom().scaleExtent([1, 100]).translateExtent([[0, 0], [width, height]]).on("zoom", function(d) {
                svg.attr("transform", d.transform);
            })).append("g");
        }
index.html
        <!DOCTYPE html>
        <html lang="en">
            <head>
                <meta charset="UTF-8">
                <meta name="viewport" content="width=device-width, initial-scale=1.0">
                <title>D3 Data Visualisation</title>
                <script type="text/javascript" src="https://cdn.jsdelivr.net/npm/d3@7"></script>
                <script type="text/javascript" src="./drawMapAndPiechart.js"></script>
                <script type="text/javascript" src="./d3Legend.js"></script>
            </head>
            <body>
                <h1 style="font-family: Verdana,serif">D3 Data Visualisation for biggest companies in the world by market capitalization</h1>
                <div id="d3vis"></div>
                <div id="d3leg"></div>
                <script>
                    redrawVisualisation("d3vis");
                    redrawLegend("d3leg");
                    window.addEventListener("resize", () => {
                        redrawVisualisation("d3vis");
                        redrawLegend("d3leg");
                    });
                </script>
            </body>
        </html>
Now it's time to load some actual data to visualise. We will start with companies data, and draw legend first.
Sample data created for this tutorial can be found here.
D3 supports both JSON and CSV formats, but JSON is native, so it should be preferred as default data format, to avoid conversion overhead.
It is imperative to format data in hierarchical structure, to utilize D3 capabilities of handling data.
Not doing so will require manual implementation of many features used by D3, such as retrieving leaves, getting sum of all values, etc.
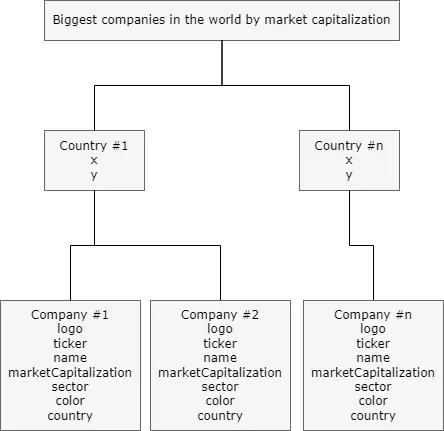
Description of data is as follows: root must contain 1 or more children representing countries.
Every country child has a name (of a country) and coordinates representing latitude (y) and longitude (x), location of a stock exchange where company listing is present.
Every country has its own 1 or more children representing a company, with its own data: marketCapitalization will be used for pie charts, other data will be used for tooltips.
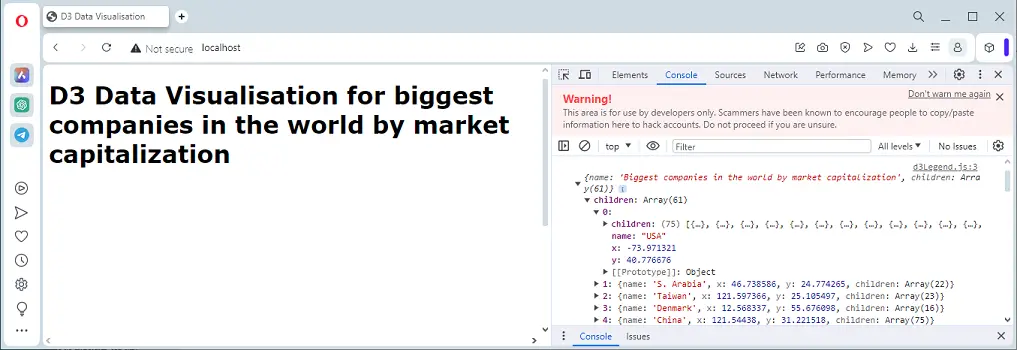
Load data using fetch. Resolve response promise to JSON, and use console output to confirm the data is loaded.
Notice that you cannot complete this step without local web server, or else you will get CORS violation error.
Checking can be performed by using console.log on resolved promise:
d3Legend.js
        function redrawLegend(divId) {
            fetch("./marketCap.json").then(d => d.json()).then(dataMarketCap => {
                console.log(dataMarketCap);
                const height = 50;
                const width = window.width;
                d3.select(document.getElementById(divId)).selectAll("*").remove();
                const svg = d3.select(document.getElementById(divId)).append("svg").attr("width", width).attr("height", height).append("g");
            });
        }
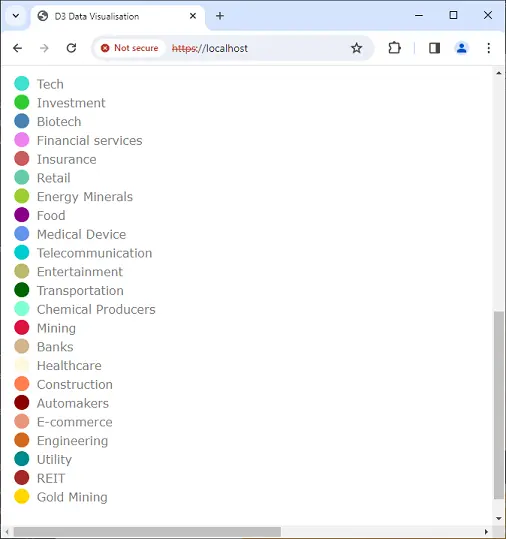
Next step is to utilize d3.js capability to create hierarchy data and then extract leaves to get color and sector, which will be used to draw the legend.
Extracting is done by flat mapping leaves, and then mapping only necessary data from elements, into final array.
Since multiple companies can be in the same sector, we need to remove duplicates using filtering function that reduces array to just single instance for each sector.
Here is code snippet for this step:
d3Legend.js
        const root = d3.hierarchy(dataMarketCap);
        const temp = root.leaves().flatMap(d => d).map(d => ({color: d.data.color, sector: d.data.sector}));
        const sectorData = temp.filter(function(d, i) {
            return temp.findIndex(function(e) {
                return e.sector === d.sector;
            }) === i;
        });
The final step for drawing a legend is to use sectorData, to iterate over it, drawing circles and writing sectors next to it, using d3 functions for drawing circles and text.
Here is a complete code for d3Legend.js, same can be found on src/d3Legend.js:
d3Legend.js
        function redrawLegend(divId) {
            fetch("./marketCap.json").then(d => d.json()).then(dataMarketCap => {
                const root = d3.hierarchy(dataMarketCap);
                const temp = root.leaves().flatMap(d => d).map(d => ({color: d.data.color, sector: d.data.sector}));
                const sectorData = temp.filter(function(d, i) {
                    return temp.findIndex(function(e) {
                        return e.sector === d.sector;
                    }) === i;
                });

                const height = 28 * sectorData.length;
                const width = window.width;
                d3.select(document.getElementById(divId)).selectAll("*").remove();
                const svg = d3.select(document.getElementById(divId)).append("svg").attr("width", width).attr("height", height).append("g");

                svg.selectAll("sectors").data(sectorData).
                enter().
                append("text").
                html(function(d){ return d.sector; }).
                attr("font-family", "Verdana,serif").
                attr("fill", "#7F7F7F").
                attr("x", function(){ return "40px"; }).
                attr("y", function(d, i){ return (25 * (i + 1)) + "px"; }).
                attr("alignment-baseline","central");
                svg.selectAll("circle").data(sectorData).
                enter().
                append("circle").
                attr("r", function(){ return "10px"; }).
                attr("cx", function(){ return "20px"; }).
                attr("cy", function(d, i){ return (25 * (i + 1)) + "px"; }).
                style("fill", function(d){ return d.color; });
            });
        }
You may want to minimize the size of your data files, so you have to faster page loading. This is especially important for larger files, such as geoJSON files.
The best way of achieving this is to compress the data file on server side, transfer it when page is loaded, and unpack it locally.
Create a compressed version of your data file, and place it in the same folder as original file. For example, if you have marketCap.json, create marketCap.json.gz.
Then, you can use pako to unpack the file. Simply include it as text/javascript into HTML header and use inflate function.
This also means that you will have to change fetch promise resolver to arrayBuffer:
d3Legend.js
        fetch("./marketCap.json.gz").then(d => d.arrayBuffer()).then(arrayMarketCaps => {
            const dataMarketCap = JSON.parse(pako.inflate(arrayMarketCaps, {to: "string"}));
Now go back to drawMapAndPiechart.js. Load market and geo data in the similar way as it was done for d3Legend.js.
Only this time we will use pako to have an optimized loading of our data:
drawMapAndPiechart.js
        fetch("./countries.json.gz").then(d => d.arrayBuffer()).then(arrayCountries => {
            const dataGeo = JSON.parse(pako.inflate(arrayCountries, { to: "string" }));
            fetch("./marketCap.json.gz").then(d => d.arrayBuffer()).then(arrayMarketCaps => {
                const dataMarketCap = JSON.parse(pako.inflate(arrayMarketCaps, { to: "string" }));
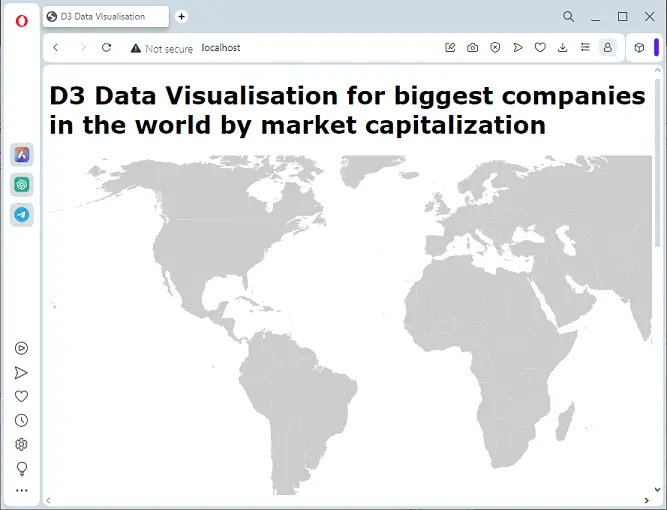
Now we have enough data to draw map of the earth.
First, prepare projection to be used for GeoJSON with const projection = d3.geoNaturalEarth1().scale(width / 1.5 / Math.PI).translate([width / 2, height / 2]);.
Then, just use d3 geoPath to draw data, applying projection that was initialized:
drawMapAndPiechart.js
        function redrawVisualisation(divId) {
            fetch("./countries.json.gz").then(d => d.arrayBuffer()).then(arrayCountries => {
                const dataGeo = JSON.parse(pako.inflate(arrayCountries, { to: "string" }));
                fetch("./marketCap.json.gz").then(d => d.arrayBuffer()).then(arrayMarketCaps => {
                    const dataMarketCap = JSON.parse(pako.inflate(arrayMarketCaps, { to: "string" }));
                    const height = 0.95 * window.innerHeight;
                    const width = 1.9 * height;

                    d3.select(document.getElementById(divId)).selectAll("*").remove();
                    const svg = d3.select(document.getElementById(divId)).append("svg").attr("width", width).attr("height", height).call(d3.zoom().scaleExtent([1, 100]).translateExtent([[0, 0], [width, height]]).on("zoom", function(d) {
                        svg.attr("transform", d.transform);
                    })).append("g");

                    const projection = d3.geoNaturalEarth1().scale(width / 1.5 / Math.PI).translate([width / 2, height / 2]);
                    svg.append("g").
                    selectAll("path").
                    data(dataGeo.features).
                    join("path").
                    attr("fill", "#CDCDCD").
                    attr("d", d3.geoPath().projection(projection)).
                    style("stroke", "none");
                });
            });
        }
Next, add pie charts with tooltips, placing them to their appropriate locations on map.
We start by generating hierarchy data from dataMarketCap by calling root = d3. Hierarchy(dataMarketCap) and then looping over countries.
For each country, we do sum of all its companies capitalisations to get a full measurement for pie proportions.
We initialize pieData for each company by using d3.pie() function, as fraction of an arc that is proportional to its value in relation to the sum of all capitalisations.
We get a pie chart by drawing a path applied to pieData, setting the inner radius to 0, outer radius to some value proportional to the sum of capitalisations, and then translating the chart by the coordinates that are found on a country as (x, y).
Coordinates also need to be projected before drawing.
We also prepare callback definitions that will be used for tooltip handling (mouseover, mousemove and mouseleave), that will be implemented later on:
drawMapAndPiechart.js
        const root = d3.hierarchy(dataMarketCap);
        for(const country of root.children) {
            const sum = country.children.reduce((accumulator, currentValue) => accumulator + currentValue.data.marketCapitalization, 0);
            const pieData = d3.pie().value(d => d.data.marketCapitalization)(country.children);
            svg.selectAll("pie").data(pieData).
            join("path").
            attr("d", d3.arc().innerRadius(0).outerRadius(Math.sqrt(sum / 20000000000))).
            attr("transform", function(d) {
                const coordinates = projection([d.data.parent.data.x, d.data.parent.data.y]);
                return "translate(" + coordinates[0] + ", " + coordinates[1] + ")";
            }).
            attr("fill", function(d){ return d.data.data.color; }).
            style("stroke", "none").
            on("mouseover", mouseover).
            on("mousemove", mousemove).
            on("mouseleave", mouseleave);
        }
All that is left is to add the tooltop. We only have pie chart with slices, so the point of a tooltip is to have additional info on specific portion of a pie chart.
Here is definition of tooltip:
drawMapAndPiechart.js
        const tooltip = d3.select("#" + divId).
        append("div").
        attr("class", "tooltip").
        style("visibility", "hidden").
        style("background-color", "white").
        style("border", "solid").
        style("border-width", "1px").
        style("border-radius", "20px").
        style("position", "fixed").
        style("max-width", "40%").
        style("padding", "10px");
We need to track mouse position on screen. Simplest way to do so is to define object to hold mouse (x, y) and use mousemove event listener to collect current data:
drawMapAndPiechart.js
        let mousePositionForTooltip = { x: 0, y: 0 };
        window.addEventListener("mousemove", event => {
            mousePositionForTooltip = { x: event.clientX, y: event.clientY };
        });
Now it's time to implement mouse callbacks for tooltip that we added in this step.
Tooltip is hidden while mouse cursor is off object, visible when mouse cursor is over some pie chart, and its position updated to follow mouse.
Tooltip HTML is also updated - it is possible that while moving the mouse, we go through multiple pie chart segments representing different companies.
To ensure we are displaying correct company info, we retrieve data from d.target.__data__.data. This underlying target object is pie segment that mouse is currently over.
We adjust the visibility of a tooltip with tooltip style visibility property, and also add some d3.color().brighter() when mouse is over for aesthetic:
drawMapAndPiechart.js
        let mouseover = function() {
            const data = d3.select(this)._groups[0][0].__data__;
            d3.select(this).style("fill", d3.color(data.data.data.color).brighter());
            tooltip.style("visibility", "visible");
        }
        let mousemove = function(d) {
            const mousePositionForTooltipOffset = 10;
            mousePositionForTooltip.x += mousePositionForTooltipOffset;
            mousePositionForTooltip.y += mousePositionForTooltipOffset;
            let tooltipText = "<p style = \"font-family: Verdana,serif;\">";
            tooltipText += "ticker: " + d.target.__data__.data.data.ticker + "<br>";
            tooltipText += "name: " + d.target.__data__.data.data.name + "<br>";
            tooltipText += "market capitalization: " + d.target.__data__.data.data.marketCapitalization + "<br>";
            tooltipText += "sector: " + d.target.__data__.data.data.sector + "<br>";
            tooltipText += "country: " + d.target.__data__.data.data.country;
            tooltipText += "</p>";
            tooltip.style("left", mousePositionForTooltip.x + "px").
            style("top", mousePositionForTooltip.y + "px").
            html(tooltipText);
        }
        let mouseleave = function() {
            const data = d3.select(this)._groups[0][0].__data__;
            d3.select(this).style("fill", data.data.data.color);
            tooltip.style("visibility", "hidden");
        }
This wraps up deployment part on how to build a simple pie chart visualisation on earth map.
Here is a complete version on drawMapAndPiechart.js:
drawMapAndPiechart.js
        function redrawVisualisation(divId) {
            fetch("./countries.json.gz").then(d => d.arrayBuffer()).then(arrayCountries => {
                const dataGeo = JSON.parse(pako.inflate(arrayCountries, { to: "string" }));
                fetch("./marketCap.json.gz").then(d => d.arrayBuffer()).then(arrayMarketCaps => {
                    const dataMarketCap = JSON.parse(pako.inflate(arrayMarketCaps, { to: "string" }));
                    const height = 0.95 * window.innerHeight;
                    const width = 1.9 * height;

                    d3.select(document.getElementById(divId)).selectAll("*").remove();

                    let mousePositionForTooltip = { x: 0, y: 0 };
                    const tooltip = d3.select("#" + divId).
                    append("div").
                    attr("class", "tooltip").
                    style("visibility", "hidden").
                    style("background-color", "white").
                    style("border", "solid").
                    style("border-width", "1px").
                    style("border-radius", "20px").
                    style("position", "fixed").
                    style("max-width", "40%").
                    style("padding", "10px");
                    let mouseover = function() {
                        const data = d3.select(this)._groups[0][0].__data__;
                        d3.select(this).style("fill", d3.color(data.data.data.color).brighter());
                        tooltip.style("visibility", "visible");
                    }
                    let mousemove = function(d) {
                        const mousePositionForTooltipOffset = 10;
                        mousePositionForTooltip.x += mousePositionForTooltipOffset;
                        mousePositionForTooltip.y += mousePositionForTooltipOffset;
                        let tooltipText = "<p style = \"font-family: Verdana,serif;\">";
                        tooltipText += "ticker: " + d.target.__data__.data.data.ticker + "<br>";
                        tooltipText += "name: " + d.target.__data__.data.data.name + "<br>";
                        tooltipText += "market capitalization: " + d.target.__data__.data.data.marketCapitalization + "<br>";
                        tooltipText += "sector: " + d.target.__data__.data.data.sector + "<br>";
                        tooltipText += "country: " + d.target.__data__.data.data.country;
                        tooltipText += "</p>";
                        tooltip.style("left", mousePositionForTooltip.x + "px").
                        style("top", mousePositionForTooltip.y + "px").
                        html(tooltipText);
                    }
                    let mouseleave = function() {
                        const data = d3.select(this)._groups[0][0].__data__;
                        d3.select(this).style("fill", data.data.data.color);
                        tooltip.style("visibility", "hidden");
                    }
                    window.addEventListener("mousemove", event => {
                        mousePositionForTooltip = { x: event.clientX, y: event.clientY };
                    });

                    const svg = d3.select(document.getElementById(divId)).append("svg").attr("width", width).attr("height", height).call(d3.zoom().scaleExtent([1, 100]).translateExtent([[0, 0], [width, height]]).on("zoom", function(d) {
                        svg.attr("transform", d.transform);
                    })).append("g");

                    const projection = d3.geoNaturalEarth1().scale(width / 1.5 / Math.PI).translate([width / 2, height / 2]);
                    svg.append("g").
                    selectAll("path").
                    data(dataGeo.features).
                    join("path").
                    attr("fill", "#CDCDCD").
                    attr("d", d3.geoPath().projection(projection)).
                    style("stroke", "none");

                    const root = d3.hierarchy(dataMarketCap);
                    for(const country of root.children) {
                        const sum = country.children.reduce((accumulator, currentValue) => accumulator + currentValue.data.marketCapitalization, 0);
                        const pieData = d3.pie().value(d => d.data.marketCapitalization)(country.children);
                        svg.selectAll("pie").data(pieData).
                        join("path").
                        attr("d", d3.arc().innerRadius(0).outerRadius(Math.sqrt(sum / 8000000000))).
                        attr("transform", function(d) {
                            const coordinates = projection([d.data.parent.data.x, d.data.parent.data.y]);
                            return "translate(" + coordinates[0] + ", " + coordinates[1] + ")";
                        }).
                        attr("fill", function(d){ return d.data.data.color; }).
                        style("stroke", "none").
                        on("mouseover", mouseover).
                        on("mousemove", mousemove).
                        on("mouseleave", mouseleave);
                    }
                });
            });
        }
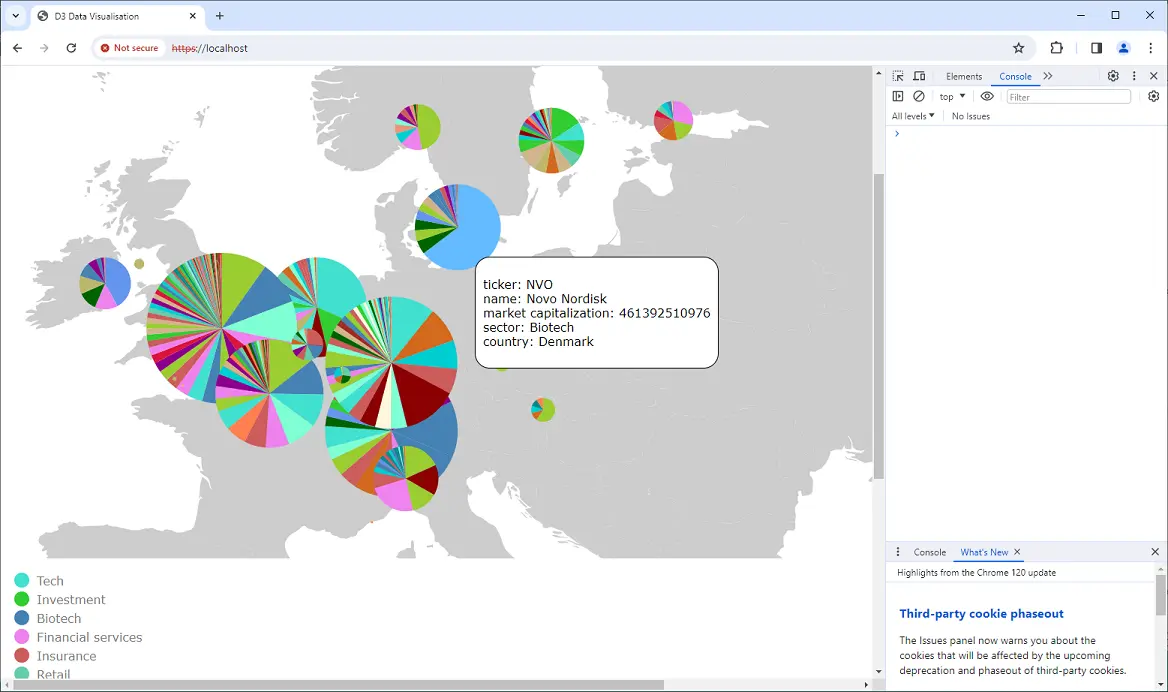
Although main job is done, current result still differs from the result shown on result page.
The reason for this is fact that much more can be done here, like adding logos if you have them, pretty print of market capitalisation, better styling of the page, etc. which is not critical for main functionality.
If you want to add logos in tooltip, make sure you have all the logos for companies you are visualizing, and place them in logos folder.
Name them according to the company's ticker and make sure the format is webp.
For pretty printing capitalisation values, create function makeReadable inside drawMapAndPiechart.js:
drawMapAndPiechart.js
        function makeReadable(value) {
            const suffixes = ["$", "k$", "M$", "B$", "T$", "Qa$"];
            const e = Math.floor(Math.log10(value) / 3);
            const b = value / Math.pow(1000, e);
            const num = b.toFixed(2);
            return num + suffixes[e];
        }
Modify tooltip callback functions to include logo and pretty printed capitalisation:
drawMapAndPiechart.js
        let mousemove = function(d) {
            const mousePositionForTooltipOffset = 10;
            mousePositionForTooltip.x += mousePositionForTooltipOffset;
            mousePositionForTooltip.y += mousePositionForTooltipOffset;
            let tooltipText = "<p style = \"font-family: Verdana,serif;\">";
            tooltipText += d.target.__data__.data.data.logo + "<br>";
            tooltipText += "ticker: " + d.target.__data__.data.data.ticker + "<br>";
            tooltipText += "name: " + d.target.__data__.data.data.name + "<br>";
            tooltipText += "market capitalization: " + makeReadable(d.target.__data__.data.data.marketCapitalization) + "<br>";
            tooltipText += "sector: " + d.target.__data__.data.data.sector + "<br>";
            tooltipText += "country: " + d.target.__data__.data.data.country;
            tooltipText += "</p>";
            tooltip.style("left", mousePositionForTooltip.x + "px").
            style("top", mousePositionForTooltip.y + "px").
            html(tooltipText);
        }
You can check out functions that are built in this tutorial on src/drawMapAndPiechart.js.
To deploy, only thing that is required is standard web server, supporting serving standard content types. Any web server will do the job.
Simply get all files from a folder created for the purpose of this tutorial, pick web server software, and follow steps to deploy HTML depending on the server that is selected.
Make sure to set up SSL also.
Visualisation for this tutorial can be found on result page.
This solution is portable, doesn't require any specific light or heavy client, installation or framework to be run on, any standard web browser can be used.
The solution is also reusable, you can put other similar type of data in (for example, the average number of cars sold annually by brand, by country), and it will generate visualisation and legend automatically.